5강 도표
Let's Check It Out
다음 표의 내용과 일치하지 않는 것은?

The table above shows the renewable energy generation capacity and its global share by region in 2020, along with its change and growth rate between 2019 and 2020. ① Asia increased its renewable energy generation capacity by 167.6 GW to reach 1,286 GW, which accounted for 46% of the total global renewable energy generation capacity. ② Capacity in Europe and Eurasia expanded by 34.3 GW and 6.2 GW, respectively, while the growth rates of the two regions were the same, at 6.0%. ③ South America ranked fourth in terms of capacity, global share, and change, but its growth rate was lower than that of Africa. ④ Oceania was the fastest growing region with a growth rate of 18.5%, although its global share was only 2%. ⑤ The Middle East and Central America & the Caribbean each accounted for 1% of the total global renewable energy generation capacity, and, among all the regions, the Middle East ranked the lowest in terms of growth rate.
{해석}
위의 표는 2020년의 지역별 재생 에너지 발전 용량과 세계 점유율을, 2019년과 2020년 사이의 변화량 및 성장률과 함께 보여 준다. 아시아의 재생 에너지 발전 용량은 167.6GW 증가해서 1,286GW에 도달했는데, 이것은 세계 재생 에너지 발전 총량의 46%를 차지했다. 유럽과 유라시아의 용량은 각각 34.3GW와 6.2GW 늘었지만, 그 두 지역의 성장률은 6.0%로 동일했다. 남아메리카는 용량, 세계 점유율, 변화량 면에서 4위를 차지했으나, 성장률은 아프리카의 성장률보다 낮았다. 오세아니아는 세계 점유율이 2%에 불과했지만, 18.5%의 성장률로 가장 빠르게 증가한 지역이었다. 중동과 중앙아메리카 및 카리브해 지역은 각각 세계 재생 에너지 발전 총량의 1%를 차지했으며, 중동은 성장률 면에서 모든 지역 중에서 최하위를 기록했다.
Exercises
1. 다음 도표의 내용과 일치하지 않는 것은?
The graph above shows the time spent playing digital games daily in Norway from 2016 to 2020 by gender. ① Men spent more than 30 minutes per day playing digital games throughout the five years, with their daily playing time increasing from 34 minutes in 2017 to 44 minutes in 2020. ② Women spent 28 minutes per day playing digital games in 2016, but their daily playing time dropped to just half of that number the following year. ③ The time spent playing digital games per day by women was the highest in 2016, and in both 2018 and 2019 women spent 19 minutes playing digital games per day, the second most time after 2016. ④ The gap between men’s and women’s daily digital game playing time was the smallest in 2016 and the largest in 2020. ⑤ Men spent more than twice as much time playing digital games per day as women over the given period with the exception of 2016.
{해석}
위의 그래프는 노르웨이에서 2016년부터 2020년까지 매일 디지털 게임을 하는 데 소요된 시간을 성별에 따라 보여 준다. 남성이 매일 게임을 하는 데 소요한 시간은 2017년 34분에서 2020년에 44분으로 증가하면서, 남성은 5년 내내 디지털 게임을 하는 데 매일 30분 넘게 소요했다. 여성은 2016년에 디지털 게임을 하는 데 매일 28분을 소요했지만, 다음 해에는 매일 게임을 하는 데 소요한 시간이 그 수치의 딱 절반으로 떨어졌다. 여성이 매일 디지털 게임을 하는 데 소요한 시간은 2016년에 가장 높았고, 2018년과 2019년 두 해에 여성은 매일 디지털 게임을 하는 데 19분을 소요했는데, 이는 2016년 다음으로 많은 시간이었다. 남성과 여성이 매일 디지털 게임을 하는 데 소요한 시간 사이의 차이는 2016년에 가장 작았고 2020년에 가장 컸다. 남성은 조사 기간 중 2016년을 제외하고 매일 디지털 게임을 하는 데 여성보다 2배가 넘는 시간을 소요했다.
2. 다음 표의 내용과 일치하지 않는 것은?
The table above shows the percentage share of trips taken by car in 2015 and the projected share for 2050, by region, including information on the changes from 2015 to 2050. ① The percentage of trips taken by car in North America was 81.2 percent in 2015, but its share is expected to decrease to 76.1 percent in 2050. ② In Europe, the percentage of the car as a mode of transportation is projected to decline to 44.4 percent in 2050, falling from 2015 by 12.0 percentage points. ③ In the Middle East and Latin America, the percentage of trips by car is expected to increase by 1.7 percentage points and 1.9 percentage points, respectively, from 2015 to 2050. ④ The percentage of trips by car in Asia is projected to climb to more than 40 percent in 2050, 12.0 percentage points up from just 28.3 percent in 2015. ⑤ In 2015, the percentage of trips taken by car in Africa was less than half that of Latin America, but the percentage in Africa is expected to be more than that of Latin America in 2050.
{해석}
위의 표는 자동차를 통한 이동의 2015년 여행 점유율과 2050년 예상 점유율을 지역별로 보여 주고 있으며, 2015년부터 2050년까지의 변화에 대한 정보를 포함하고 있다. 북아메리카에서 자동차로 이동하는 비율은 2015년 81.2%였으나 2050년 76.1%로 점유율이 감소할 것으로 전망된다. 유럽에서 교통수단으로서의 자동차 비율은 2015년보다 12.0퍼센트포인트가 하락하여, 2050년에 44.4%로 감소할 것으로 예상된다. 중동과 라틴아메리카의 경우 자동차로 이동하는 비율이 2015년부터 2050년까지 각각 1.7퍼센트포인트, 1.9퍼센트포인트 증가할 것으로 전망된다. 아시아에서의 자동차를 통한 이동 비율은 2015년의 28.3%에 불과했던 것에서 12.0퍼센트포인트 상승하여 2050년에는 40% 넘게 증가할 것으로 예상된다. 2015년 아프리카에서 자동차로 이동한 비율은 라틴아메리카의 절반에도 못 미쳤지만 2050년에는 아프리카에서의 비율이 라틴아메리카의 비율보다 더 많아질 것으로 전망된다.
3. 다음 도표의 내용과 일치하지 않는 것은?
The graph above shows how the degree to which healthcare consumers trust in their health service providers to keep their information secure changed between 2017 and 2020 in the U.S. ① Over the three years covered by the graph, more than 80% of healthcare consumers trusted in their medical professionals. ② The percentage of consumers who said they trusted in their medical professionals in 2019 differed by only 1 percentage point from that in 2017. ③ In 2020, the percentage of consumers who did not trust in their medical professionals was bigger than that in 2019, but the percentage of consumers who responded to the trust in their medical professionals “very much” was more than double that in 2017. ④ Unlike the percentage of the trust in medical professionals, that in tech companies did not exceed 50 percent in 2019 and 2020, respectively. ⑤ Moreover, it is worth noting that the percentage of consumers who said they did not trust in tech companies at all more than doubled from 2017 to 2020.
{해석}
위의 그래프는 미국에서 2017년과 2020년 사이에 의료 소비자가 정보 보안을 유지함에 있어서 의료 서비스 제공자를 신뢰하는 정도가 어떻게 변화했는지 보여 준다. 그래프가 다루고 있는 3년 동안 80%가 넘는 의료 소비자가 자신의 전문 의료진을 신뢰했다. 2019년 자신의 전문 의료진을 신뢰한다고 말한 소비자의 비율은 2017년의 비율과 겨우 1퍼센트포인트 차이가 났다. 2020년에는 자신의 전문 의료진을 신뢰하지 않는 소비자의 비율이 2019년의 비율보다 더 컸지만, 자신의 전문 의료진에 대해 ‘매우 많이’ 신뢰한다고 응답한 소비자의 비율은 2017년의 비율의 두 배가 넘었다. 전문 의료진에 대한 신뢰도의 비율과 달리, 2019년과 2020년 각각 기술 기업에 대한 신뢰도의 비율은 50%를 넘지 않았다. 더욱이 2017년부터 2020년까지 기술 기업을 전혀 신뢰할 수 없다고 말한 소비자의 비율이 두 배가 넘었다는 것도 주목할 가치가 있다.
4. 다음 도표의 내용과 일치하지 않는 것은?
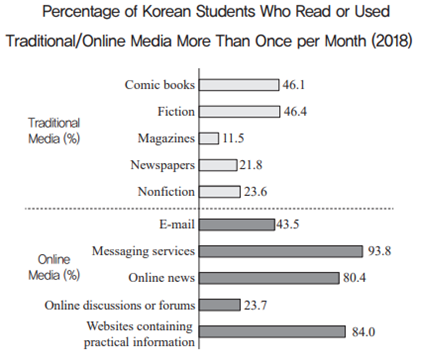
The graph above shows the percentage of Korean students who read or used traditional/online media more than once per month in 2018. ① The two most popular traditional media types among Korean students were comic books and fiction, but the percentages of students who read them did not exceed 50% in either case. ② As for the other traditional media types, more Korean students read nonfiction than newspapers or magazines. ③ For online media, the percentage of students who used messaging services was 93.8%, which was more than twice that of students who used e-mail. ④ Online news was read or used by more Korean students than websites containing practical information. ⑤ In the case of online media, the smallest percentage of Korean students said they read or used online discussions or forums more than once per month.
{해석}
위의 그래프는 2018년 한 달에 한 번 넘게 전통 매체나 온라인 매체를 읽거나 이용한 한국 학생 비율을 보여 준다. 한국 학생 사이에 가장 인기 있는 두 가지 전통적인 매체 유형은 만화책과 소설이었지만, 그것들을 읽은 학생의 비율은 어느 쪽도 50%를 넘지 않았다. 다른 전통 매체 유형에 있어서, 더 많은 한국 학생이 신문이나 잡지보다 논픽션을 읽었다. 온라인 매체의 경우, 메시지 서비스를 이용한 학생의 비율은 93.8%였는데, 이는 이메일을 이용한 학생 비율의 2배가 넘었다. 온라인 뉴스는 실용적인 정보를 담고 있는 웹 사이트보다 더 많은 한국 학생에 의해 읽히거나 이용되었다. 온라인 매체의 경우 가장 작은 비율의 한국 학생이 한 달에 한 번 넘게 온라인 토론이나 포럼을 읽거나 이용한다고 말했다.
'고등학교 기타 > 수능특강 영어' 카테고리의 다른 글
| 2023학년도 수능완성 영어영역 7강 실용문 (0) | 2022.07.16 |
|---|---|
| 2023학년도 수능완성 영어영역 6강 세부 내용 파악 (0) | 2022.07.16 |
| 2023학년도 수능완성 영어영역 4강 글의 제목 (0) | 2022.07.16 |
| 2023학년도 수능완성 영어영역 3강 글의 주제 (0) | 2022.07.16 |
| 2023학년도 수능완성 영어영역 2강 필자의 주장·글의 요지 (0) | 2022.07.16 |
댓글